

Publication date: November 19, 2026
AEX
On Thursday morning, November 19, the AEX stood at 1,103 points. This puts the index 36 points, or 3.15%, lower than a week earlier.

Outlook
The AEX has experienced a weak and volatile trading week so far. On Monday, the index reached its highest level of the week at 1,143 points, followed by a preliminary low of 1,096 points on Wednesday.
This price movement is in line with our forecast from last week. However, the magnitude and trajectory of the decline have prompted us to adjust our medium-term forecast.
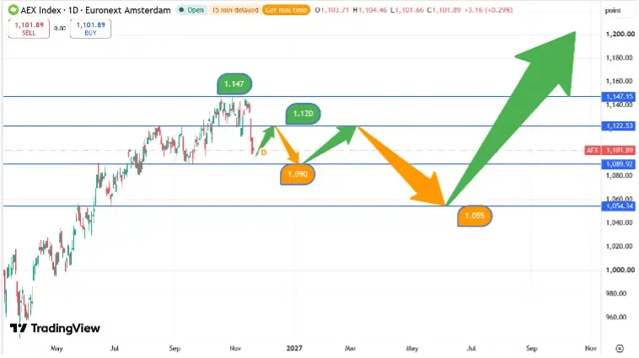
From 1,096 points, the AEX could recover in the short term to around 1,120 points. Subsequently, our model anticipates a further decline to approximately 1,090 points.
For the medium term, with a horizon of approximately six months, our model expects another recovery from this level to about 1,120 points, followed by a further decline to approximately 1,055 points. This means the correction within the long-term uptrend could reach approximately 8% relative to the record high of 1,147 points.
Once this corrective phase is complete, our model suggests there will be room for the long-term uptrend to resume. Our price target of 1,230 points therefore remains unchanged.
The chart below shows the AEX’s price performance since mid-2026 and our expected future price trajectory.
Nasdaq Futures
On the morning of Thursday, November 19, the Nasdaq futures contract is trading at 27,690 points. This puts the futures contract 540 points, or 1.9%, lower than a week earlier.

Outlook
The Nasdaq futures contract is also experiencing a weak and highly volatile trading week. The price decline unfolded in line with our expectations, although the previously forecast level of 26,300 points was not reached.
On Monday, the futures contract was still trading at 28,280 points, followed by a preliminary low of 26,658 points on Tuesday. This represented a decline of approximately 5.75%. Subsequently, the Nasdaq futures contract staged a strong recovery, rising by about 3.9% from the low.
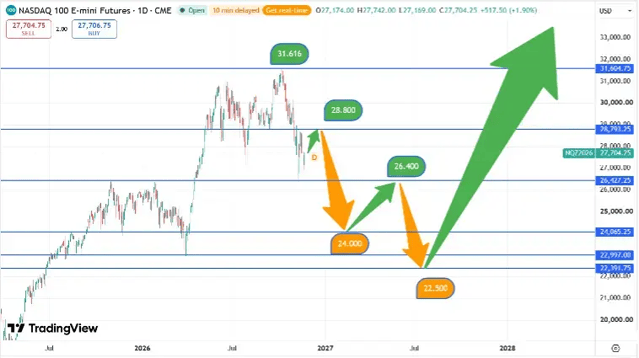
Our model views this rebound as a temporary recovery within a broader corrective phase. In the short term, we anticipate a further rise to approximately 28,800 points, followed by a new decline toward 24,000 points.
For the medium term, our model forecasts another recovery from this level, followed by a final decline to approximately 22,500 points. This would mark the end of a substantial corrective phase, with the total price decline from the previous peak potentially amounting to approximately 28%.
Despite this significant risk of a correction, our positive long-term scenario remains intact for now. Once the correction is complete, our model expects the upward trend to resume, with the price target of 32,500 points remaining unchanged.
The chart below shows the price movement of the Nasdaq futures contract since early 2026 and our expected future price trajectory.
S&P 500
On the morning of Thursday, November 19, the S&P 500 index stood at 7,408 points. This puts the index 185 points, or 2.4%, lower than a week earlier.
Forecast
The S&P 500 is also experiencing a volatile trading week, with price movements in line with our earlier forecast. During the sharp decline on Tuesday and Wednesday, the index reached the anticipated level of 7,290 points. Since then, a strong recovery has taken place, bringing the index back above 7,400 points.
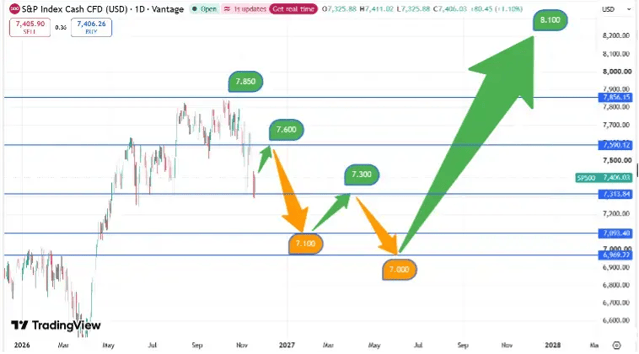
Our model views this rebound as a temporary recovery within a broader corrective phase. In the short term, the index could rise further to around 7,600 points. Subsequently, our model anticipates a new decline toward 7,100 points.
In the medium term, our model expects another recovery from this level, followed by a final decline to approximately 7,000 points. The broader corrective phase could come to an end within this price range.
If a convincing bottom forms around this level, our model suggests there will be room for a resumption of the long-term uptrend. This keeps our price target of approximately 8,100 points on track.
The chart below shows the price movement of the S&P 500 index since early 2026 and our expected future price trajectory.
Every Friday afternoon, we publish the market calendar for the coming week. Would you like to receive the market calendar by email? You can sign up here.
In the market calendar, we cover the most important topics with commentary and our outlook. Read the market calendar for November 16 through November 20, 2026, here, and starting Friday afternoon,you can read the market calendar for the upcoming week of November 23 through November 27 here.
Disclaimer: Investing involves risks. Our analysts are not financial advisors. Always consult an advisor when making financial decisions. The information and tips provided on this website are based on our analysts’ own insights and experiences. They are therefore intended for educational purposes only.