

Publication Date: November 5, 2026
AEX
On Thursday morning, November 5, the AEX stood at 1,142 points. This puts the index 7 points, or 0.6%, higher than a week earlier.
Outlook
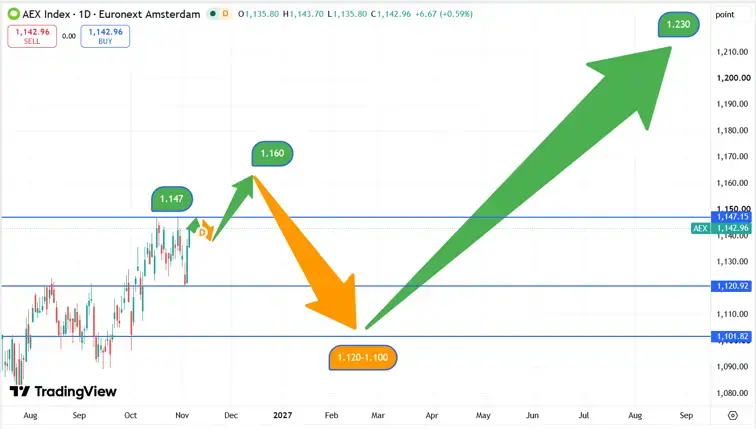
The AEX fell back to 1,121 points on Tuesday. According to our model, this marks the end of the short-term correction. Under our base scenario, the index could retest its record high of 1,147 points. After a slight correction, we expect a further rise toward our price target of 1,160 points.
After that, we anticipate another correction to around 1,120 points. Once this phase is complete, the AEX could resume its long-term uptrend. This would bring our price target of 1,230 points into view.
The chart above shows the AEX’s price movement since mid-July 2026 and our projected future price movement.
Nasdaq Futures
On the morning of Thursday, November 5, the Nasdaq futures contract is trading at 28,340 points. This puts the futures contract 1,587 points, or 5.3%, lower than a week earlier.
Outlook
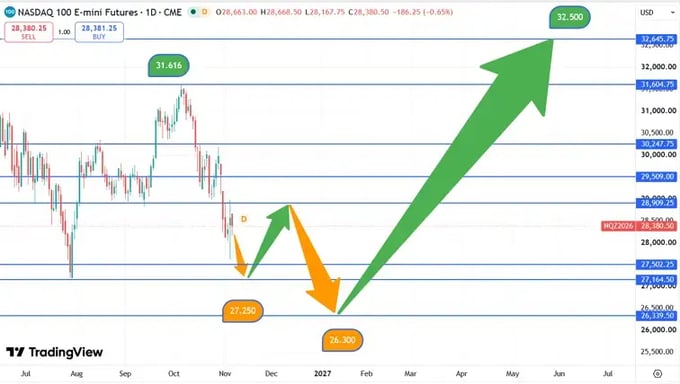
The Nasdaq futures reached 28,969 points on Wednesday. This suggests that the expected short-term recovery has run its course. In the short term, we anticipate a continuation of the correction to around 27,250 points. Around this level, this phase of the larger correction may come to an end, after which a recovery toward 29,000 points is possible. Subsequently, our model anticipates a new downward phase, during which the futures contract could fall back to approximately 26,300 points.
Despite this risk of a correction, our positive long-term scenario, with a price target of 32,500 points, remains unchanged for the time being.
The chart below shows the price movement of the Nasdaq futures contract since July 2026 and our expected future price trajectory.
S&P 500
Starting this week, we are including the S&P 500 index in our market analyses. This broadly diversified index is regarded worldwide as a key barometer for the U.S. stock market and also plays a role in the asset management of our partner, In2Markets.
To implement its Dynamic Growth asset management strategy, In2Markets uses our market analyses, which we also share with you via Money Care.
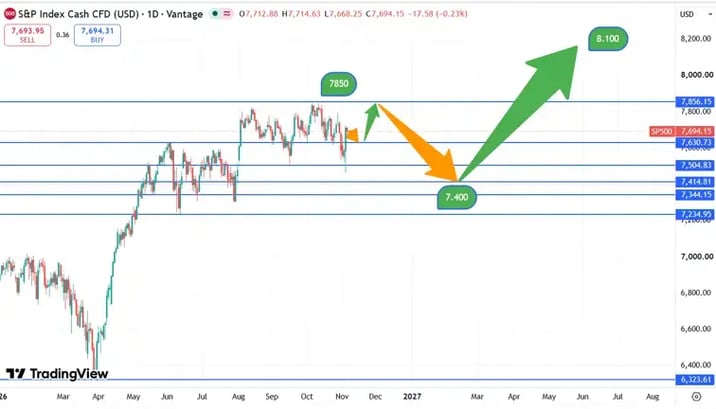
On the morning of Thursday, November 5, the S&P 500 index stood at 7,692 points. This puts the index 46 points, or 0.6%, lower than a week earlier.
Outlook
According to our model, the short-term correction reached its low at 7,460 points on Wednesday and has now concluded. Following the subsequent strong rally, our base scenario anticipates a slight correction first, followed by a further rise toward the record high of 7,850 points.
After that, we foresee a pullback toward the 7,400-point range. This could mark the end of the larger corrective phase. If a convincing bottom forms around this level, the S&P 500 could resume its long-term uptrend. This would bring our price target of approximately 8,100 points into view.
The chart below shows the price movement of the S&P 500 index since early 2026 and our expected future price movement.
Every Sunday morning, we publish the Economic calendar for the coming week. Would you like to receive the economic calender by email? You can sign up here.
In the economic calendar, we cover the most important topics with commentary and our outlook. Read the economic calendar for November 2 through November 6, 2026, here, and starting Friday afternoon, you can read the market calendar for the upcoming week of November 9 through November 13 here: .
Disclaimer: Investing involves risks. Our analysts are not financial advisors. Always consult an advisor when making financial decisions. The information and tips provided on this website are based on our analysts’ own insights and experiences. They are therefore intended for educational purposes only.