Research 9 february 2024
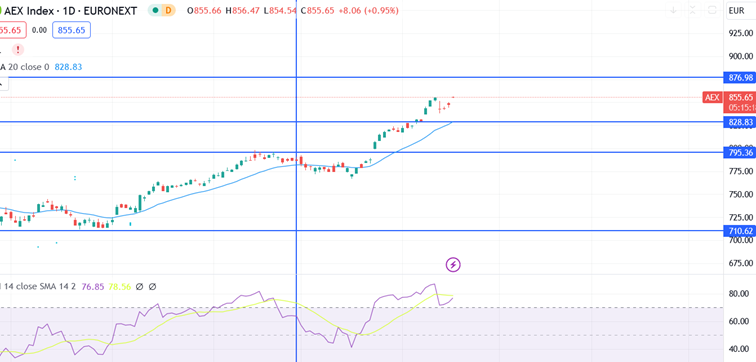
It is Friday, February 9th, and the AEX is at 850. That is 27 points higher than last week.
Below, you will find the chart of the AEX since October 2023, with the level of 798 as the old top and the correction that followed. You can also see the strong breakout that surpasses the old record level of 830. The vertical line marks the beginning of 2024.
Led by technology stocks, the AEX has reached its highest level ever. A rise of approximately ten percent without significant correction is a unique occurrence. The system has detected a strong upward trend and has set a target level of 875 for 2024, but the straight climb to these levels of the AEX was not anticipated.

What is the expected trend for the AEX Index?
Every investor knows that trees do not grow to the sky and that a correction always comes. This remains true in this case. The AEX is expected to undergo an interim decline. Based on this correction, we may expect a new target level. The target level is still pending however, it may exceed the existing 875.
For this moment the algorithm expects that there is room for the rise to continue up to 855-860, followed by a counter-movement. This could decrease to 830, but a further drop to 795-800 is not excluded. For now, we must wait to see where the rise ends and then make a proper analysis for the correction and the subsequent rise.
Price movement in the Nasdaq
Below is the chart of the Nasdaq100 since December 2023, currently at the level of 17,900. You can see the upward trend and the correction, followed by the continuation of the trend. We expected a modest correction to around 16,125 in the first weeks of this year. You can see this correction immediately after the vertical line that marks the beginning of 2024. The trend is strongly upward with a target of 19,000 in 2024.

What is the expected trend for the Nasdaq?
The algorithm issued a strong buy signal for the Nasdaq on January 10th, this was taken into the portfolio. Given the pattern, the risk of a larger correction had also increased in the Nasdaq. As a result, the system issued an exit signal, securing a nice result.
The algorithm issued a strong buy signal for the Nasdaq on January 10th, this was taken into the portfolio. Given the pattern, the risk of a larger correction had also increased in the Nasdaq. As a result, the system issued an exit signal, securing a nice result.
For the moment, the trend remains strongly upward, but the system indicates that we should wait on the sidelines for now, given the relatively flat movement of the price in the past week.
Disclaimer: Investing involves risk. Our analysts are not financial advisors. Always consult an advisor when making financial decisions. The information and tips provided on this website are based on our analysts' own insights and experiences. They are therefore for educational purposes only.

.svg)
.webp)

.webp)
.webp)


