Publication date: Nov. 14, 2024
Movement of the AEX Index
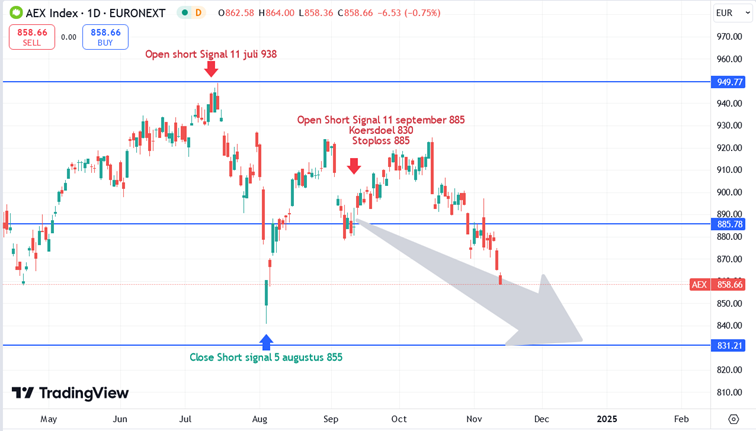
It is Thursday, Nov. 14, and the AEX is at 864 in the morning session. That is 14 points (1.6%) lower than last week's reading. below is the chart of the AEX over the past 6 months. You can see the previous trades and the most likely scenario plotted.
Last week, the AEX fell from 897 to the 874 level following the Republicans' election victory in the US. On Monday, the AEX recovered to 882 before continuing its decline. Especially after breaking through the strong support at 870, the index fell smoothly back to our first price target at 860 before dropping through to 857. Currently, the index is recovering slightly to 864.
What does this mean for sentiment on the AEX?
Sentiment in the EU stock markets continues to be characterized as "tired and uncertain."
The upward stretch was already waning but Mr. Trump's election victory is making the near future uncertain for many European companies.
What is the AEX's outlook?
The algorithm on Wednesday lowered the price target from 860 to 830. The stop loss of the short position was lowered from 910 to 885. Our clients have received notification of this via WhatsApp/Email. The most likely scenario remains that the AEX has completed the recovery in the 920-925 zone. Subsequently, the longer correction will be completed by a decline of the AEX to the 830 level. For the long term, the outlook is so uncertain that the algorithm has a neutral outlook after reaching the price target at 830. This is related to the high level of uncertainty regarding the course of economic developments in the EU.
Reflection: read our view of the AEX of November 7, 2024, here
What happened on the Nasdaq this past week?
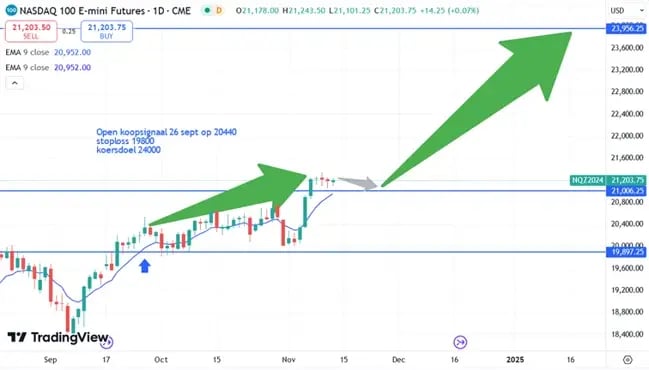
The Nasdaq futures are currently at 21,105 which is 165 points (+0.8%) higher than last week's reading. The Nasdaq futures are moving sideways around 21,200 this week after last week's nice price jump.
What is the forecast for the future of Nasdaq?
Positive. The Nasdaq futures with its U.S. Tech funds will still briefly post a sideways to slightly lower price after last week's rise. However, the most likely scenario gives a price target of 24,000 by 2025. Thus, the Nasdaq could still rise about 15% in the somewhat short term. The stop loss of the running long position remains at 19,800 points.
Below is the Nasdaq futures chart over the past 3 months with the most likely scenario plotted.
What happened on the Dow Jones Index this past week?
As mentioned last week, we will broaden our analyses and trading to incorporate the Dow Jones Industrial Index.
This index represents the 30 largest capitalized publicly traded stocks in the US. The DJIA can be compared to the AEX in terms of entry and performance.
Both indices have risen more than 60% over the past four years spaciously. We expect However, we expect more good opportunities in the US than in the EU in the coming years, hence the expansion. Over the past week, we also see a sideways pattern in the DJIA after last week's strong rise. The index is moving between 44,000 and 44,500.
What is the outlook for the Dow Jones Industrial Index?
First things first a graph over the past 12 months to get a clear picture of the progress of the index. This clearly shows the trend upward.
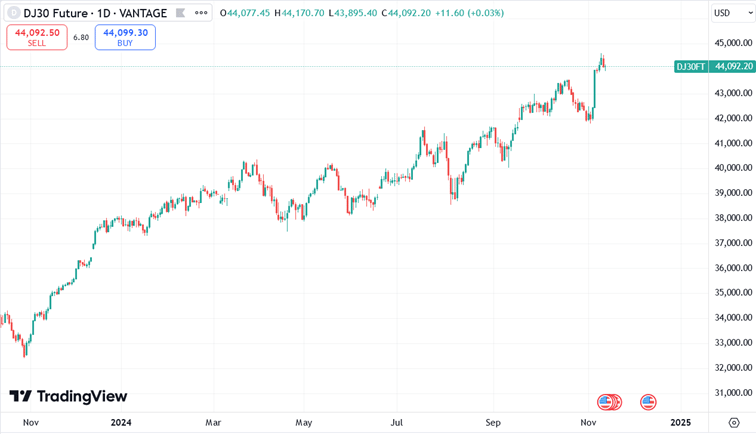
The expectation according to our algorithm does not deviate much from the Nasdaq. It's positive.
The DJIA is expected to undergo a slight correction in the coming week, dropping to around 43,600-43,200, before resuming its upward trajectory towards the initial 2025 price target of 48,000
In the relatively short term that's an increase of circa 10%.We are currently awaiting the correction before issuing a buy signal.


.svg)


.webp)

.webp)
.webp)

