.svg)
.svg)
.svg)
.svg)
.svg)
.svg)
Stock price development AEX Index
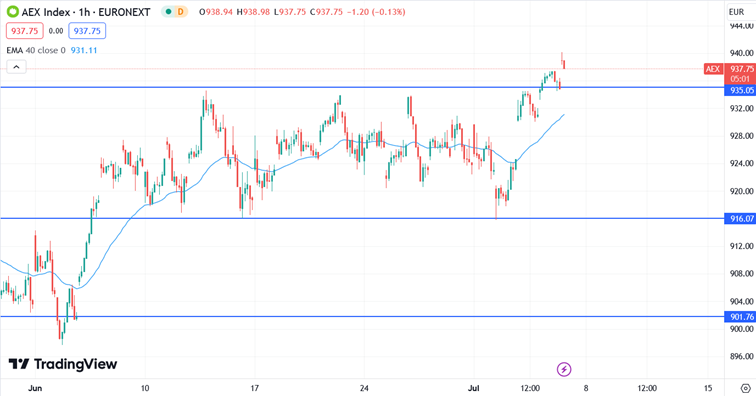
It is Friday, July 5, and the AEX is at 938 in the morning session. That is 12 points higher than last week's reading.
The AEX started the week weakly with a low at the familiar support of 916 only to set a new top towards the end of the week at 940. Having previously bounced off heavy resistance and our old price target of 935 three times, this barrier has been broken.
Looking at the AEX chart from June 1, it's evident that the index tested the 935 level three times starting from June 6, only to retreat into the narrow range between 935 and 916. The breakout attempt to reach 940 lacked conviction, leaving the movement uncertain.
What is the expectation for the Stock price of the AEX Index?
When 935 is broken, many technical analysis systems turn the signals to green, but our algorithm indicates that the breakout is not powerful enough which raises the possibility of a so-called false breakout and the index falls back into last month's range between 935 and 916.
The AEX has not yet found the momentum we talked about last week. This may well come from the monthly labor figures from the US. These will be published at 2:30 p.m. today. If the AEX closes strongly above 935 as a result of these figures then we may be able to expect a buy signal over next week. For now, caution is advised.
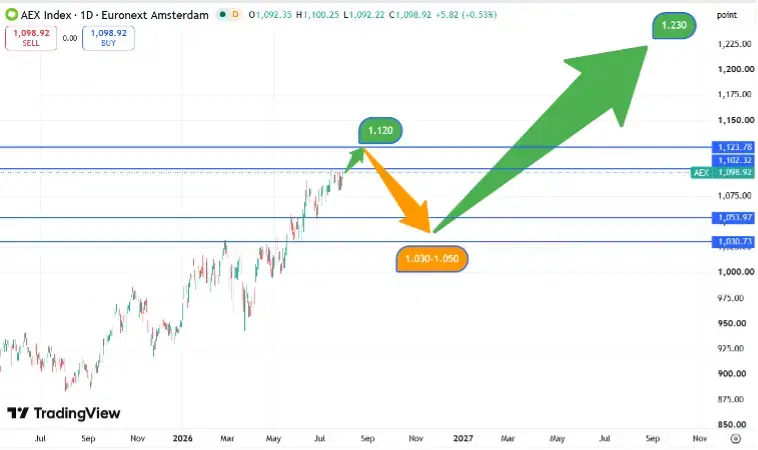
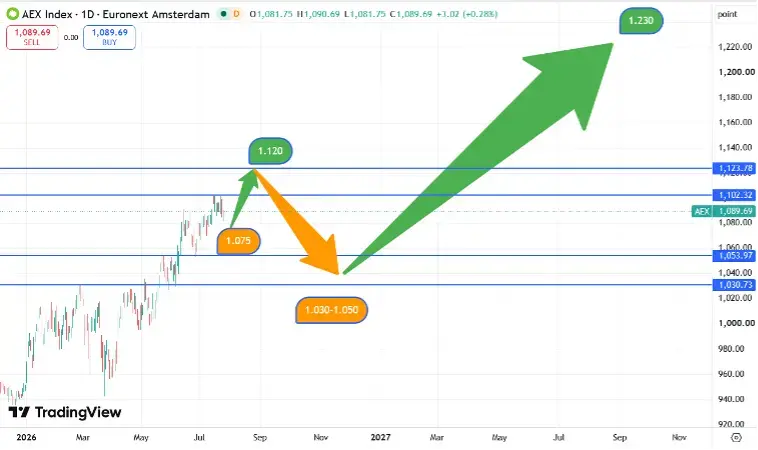
The underlying trend is strongly upward and the long-term price target remains 1025 but the most likely scenario for the AEX in the short term is a drop to 916.
Review: Read our outlook on the AEX Index from June 28, 2024
Stock price movement of the Nasdaq
The Nasdaq futures are currently at 20,435 which is 335 points higher than last week's reading.
What is the expectation of the Nasdaq's stock price movement?
The same applies to the Nasdaq as to the AEX. The upper limit of 20,400 has been breached but without conviction. So here too, there is a higher probability of the Nasdaq futures falling back into the sideways range of 20,400-19,700 in the short term. So the momentum up may also come for the Nasdaq from this afternoon's 2:30 p.m. figures.
For the long term, the price target remains 21,500 but a correction to the levels 19,700 to 19,200 is the most likely move and the prelude to the next jump to the 21,500.
Below is the chart of the Nasdaq100 -future as of June 1. You can see the relatively sideways move from June 13 and the decline after reaching the first price target of 20,400. The breakout is minimal and as yet inconclusive.

Major stock market news in the week of July 8, 2024 through July 12, 2024
As reported, on July 5 at 2:30 p.m., the monthly Labor figures in the US will be released. This is the most important event for the markets. The forecast is slightly revised to an increase of 191,000 jobs and an unemployment rate of 4. Average hourly earnings are expected to have increased 0.3% in June. For the numbers, good for the economy is bad for the stock market. For example, should hourly earnings have increased more than 0.3%, that is a positive sign for the economy but will drive inflation. As a result, the Fed sees no reason to cut interest rates.
In the week ahead, we look forward to U.S. inflation (CPI) figures coming out at 2:30 p.m. on Thursday. The PPI (producer price index) follows at 2:30 p.m. on Friday.
Disclaimer: Investing involves risk. Our analysts are not financial advisors. Always consult an advisor when making financial decisions. The information and tips provided on this website are based on our analysts' own insights and experiences. Therefore, they are for educational purposes only.
.webp)

.webp)
.webp)