.svg)
.svg)
.svg)
.svg)
.svg)
.svg)
Price movement AEX Index
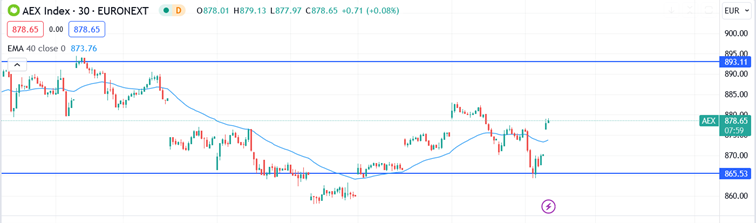
It is Friday, April 26, and the AEX is at 878 in the morning. That's up 20 points from last week, bringing the AEX back sharply from last week's decline to 853.
Above is the chart of the AEX over the past two weeks. You can see the decline from the top at 893. This was followed by a volatile - and risky - period. This is typical of a corrective price movement. The AEX is holding the important 865 level and heading strongly towards the 878.
As we described last week, the sharp drop from 893 to 853 was motivated by fear. Indeed, we may define the previous week's decline and price action as the correction within the uptrend. After a week with substantial price movements, the most probable scenario is a continuation of the trend up to the price target of 920.
What is the expected trend for the AEX Index?
The major trend in the stock markets is upward, and a correction is always part of that. On the way to our target of 920, the first stop is naturally the well-known peak at 893. There, the system will indicate whether we should take profits due to a higher likelihood of a top formation, or if the market has enough strength to stabilize briefly around 893 and then push directly towards 920.
On the downside, the 853 and 845 levels are important. As indicated last week, this zone remains the crucial support for the uptrend. A break below 845 will change the preferred scenario and the algorithm will indicate a pattern to approximately 800.
Backtrack: Read our outlook on the AEX Index from April 19, 2024
Price movement in the Nasdaq
The Nasdaq futures are currently at 17,750, which is 335 points higher than last week. For the Nasdaq, the same scenario applies to the AEX; is also still in the uptrend, but here too fear reigned supreme, and a brief reversal was made.
What is the expected trend for the Nasdaq?
For the Nasdaq, it is also the most likely scenario that the correction is over and the upward trend will continue. The algorithm has issued a buy signal with a target of 18,700. It will be determined if we should temporarily exit or if the upward momentum is strong enough to continue directly towards this year's target of 22,500.
On the downside, a level of 16,200 is crucial. We may look at a different scenario upon breaking the 16,200 barrier and not rule out the possibility of the Nasdaq falling further to the 14,500 level.
Below is the chart of the Nasdaq100 futures over the past two weeks. You can see the substantial corrective decline and then, on the far right the setup of the uptrend with a price target of 18700.

Disclaimer: Investing involves risk. Our analysts are not financial advisors. Always consult an advisor when making financial decisions. The information and tips provided on this website are based on our analysts' own insights and experiences. They are therefore for educational purposes only.
.webp)

.webp)
.webp)