.svg)
.svg)
.svg)
.svg)
.svg)
.svg)
Current AEX price movement
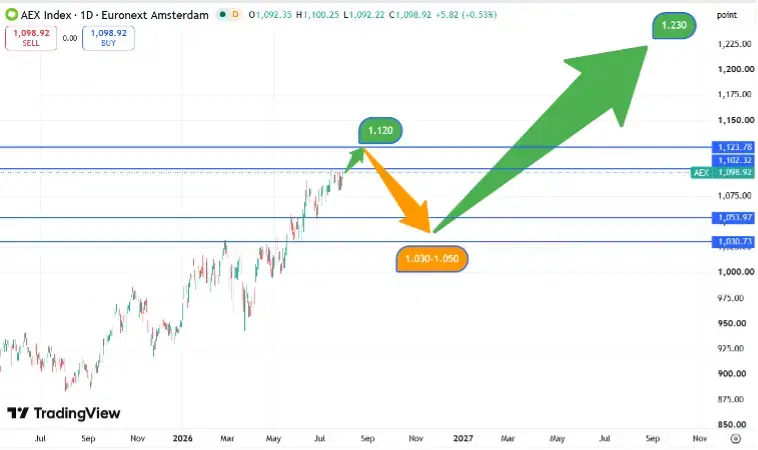
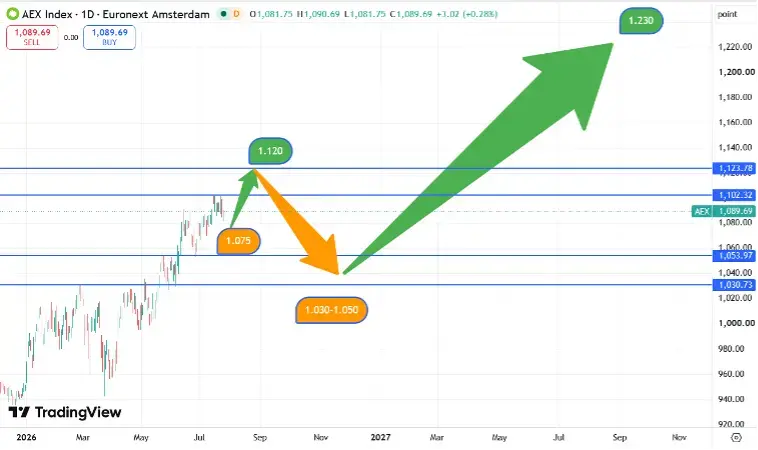
It is Friday, June 14, and the AEX is at 927 in the morning session. This is 3 points higher than last week's reading. Above is the chart of the AEX over the past seven weeks. This is the period after the larger correction in April. You can see the rise that followed and the sideways range as of May 11. The breakout at the top is defined as the final sprint to the long-calculated price target.
You can also see the zone around 900 drawn in, and the first price target of the correction at 874.
.webp)
In last week's update, we indicated that there was a reasonable probability that the price target of 935 will be met and that subsequently, the most likely scenario for the AEX will be a correction to 874.
In the past week, the AEX did indeed set the preliminary high at 934.5 before beginning the decline. The rise to 934 was due to better-than-expected inflation data from the U.S. on Wednesday. Thursday's decline to 922 is a setup for a further decline which could thus go to the 874 point.
What is the expectation for the price development of the AEX index?
The algorithm has long indicated the price target at 935. This has been met and the most likely scenario for the AEX in the short term is a test of 930 before continuing the correction. Below 922 there may even be a short signal. The first price target is 900. For the long term, the scenario is that the AEX will stabilize around 900 before continuing the decline to 874. We can expect some lower prices in the AEX in the coming weeks and we should stay sharp on profitable long-term buying opportunities.
The long trend is still strongly upward. The algorithm has given the price target of 1025 for a long period. The expected decline in the AEX to 874 is therefore a correction within an upward trend. The correction may even continue to 825 without ending the uptrend.
Backtrack: Read our outlook on the AEX Index from June 7, 2024
The course of the Nasdaq
The Nasdaq futures are currently at 19,900, which is 875 points higher than last week's reading.
The Nasdaq is currently showing more strength in comparison to the AEX with its Tech funds. The algorithm expected a somewhat sideways move between 18600 and 19200 last week but the Nasdaq is going above that. The big rise is partly due to the new expiration month for the futures nevertheless, the Nasdaq continues to show that it is in a strong uptrend. The position in the Nasdaq remains in the portfolio with a price target of 20,500.
What is the expected price movement of the Nasdaq?
The most likely scenario for the coming week is another relatively sideways move in which the volatile Nasdaq moves between 19,600 and 20,400. Upon reaching the 20,400 mark, our algorithm will determine whether long positions should start to be cashed out or whether the Nasdaq will move to the long-term price target at 21,500 directly. The trend is very strong upward with a long-term price target of 21,500. Only below the 17,000 point line will the system confirm the trend reversal and can we look further down. For now, the Tech sector is moving strongly upward.
Below is the chart of the Nasdaq100 futures since January 1, 2024. You can see that the index is trending up very strongly and that the price targets are coming in sight, After the solid correction within the uptrend in April.
Chart: Nasdaq 100 future from 1 January 2024 to 16 July 2024

Important stock market news for the week of June 17, 2024, to June 21, 2024
In the past few weeks, we have had the most important numbers and events for this month. Still, we do need to pay extra attention to the retail sales (Tuesday, 2:30 p.m.) and the Purchasing Managers' Index (PMI) on Friday at 3:45 p.m..
Disclaimer: Investing involves risk. Our analysts are not financial advisors. Always consult an advisor when making financial decisions. The information and tips provided on this website are based on our analysts' own insights and experiences. They are therefore for educational purposes only.
.webp)

.webp)
.webp)